Here’s the San Marcos Market Report for August 2023. And here’s the Market Report for July as a comparison in case you missed it.
The San Marcos real estate market continues to shift. This report does not include private sales, mobile homes or multi-family housing This information is taken from the MLS and believed accurate at the time this report was published, but not guaranteed.
Buyers and sellers should have current information about local market conditions so they can make informed buying and/or selling decisions. Reading a Market Report is a good way to obtain this information.
70 homes sold in August 2023 in San Marcos, 32% more than last month. Here’s the breakdown of activity.
MARKET REPORT DETAILS
Single Family Homes Sold – 45 (up 13%). 15 Average Days on Market. The Average Sales Price was $1,123,774 (down 10%). Average sale price was 101% of original asking price.
Condos, Townhomes and Duplexes Sold – 25 (up 92%). 23 Average Days on Market. The Average Sales Price was $694,622 (up 15%). The average sale price was 100% of original asking price.
Overall sales volume in August increased significantly from July. There were more single family home sales, and almost twice as many condo, townhome and duplex sales. The average sales price declined for single family homes, but was higher for condos, townhomes, and duplexes. Sales prices ranged from $240,000 to $3,600,000.
Compared to August 2022, 1 more single family home sold in 2023. There were 2 fewer condo, townhome and duplex sales in 2023. The average sales price for single family homes in 2023 was 4% higher than in 2022 (median was 8% higher). Similarly, the average price was 15% higher in August 2023 for condos, townhomes and duplexes. The median price for condos, townhomes and duplexes in 2023 was 12% higher than 1 year ago.
The average time on the market in August was several shorter for single family homes, but 2 weeks longer for condos, townhomes and duplexes than last month. 41% of the homes went pending in 7 days or less.
Some home buyers negotiated their sales prices down from list price. At the same time, however, 64% of the buyers paid asking price or higher. The median sales price of the single family homes was $1,065,990, down 7% from last month. The median sales price was $726,000for condos, townhomes and duplexes (up 36%).
The San Marcos housing inventory improved modestly in August, with 56 homes for sale at the end of the month (up 5). List prices range from $198,000 to $2,950,000. This is a supply of 1.2 months for condos, townhomes and duplexes (up from 28 days last month). There is a supply of 22 days for single family homes (down from 24 days last month). These are based on the rate of sales over the last 3 months.
San Marcos continues to be a very strong seller’s market based on current supply and demand.
61 new listings came on the market in August, an increase from last month (52). The number of homes going pending decreased slightly, from 40 to 38, excluding homes that closed in August.
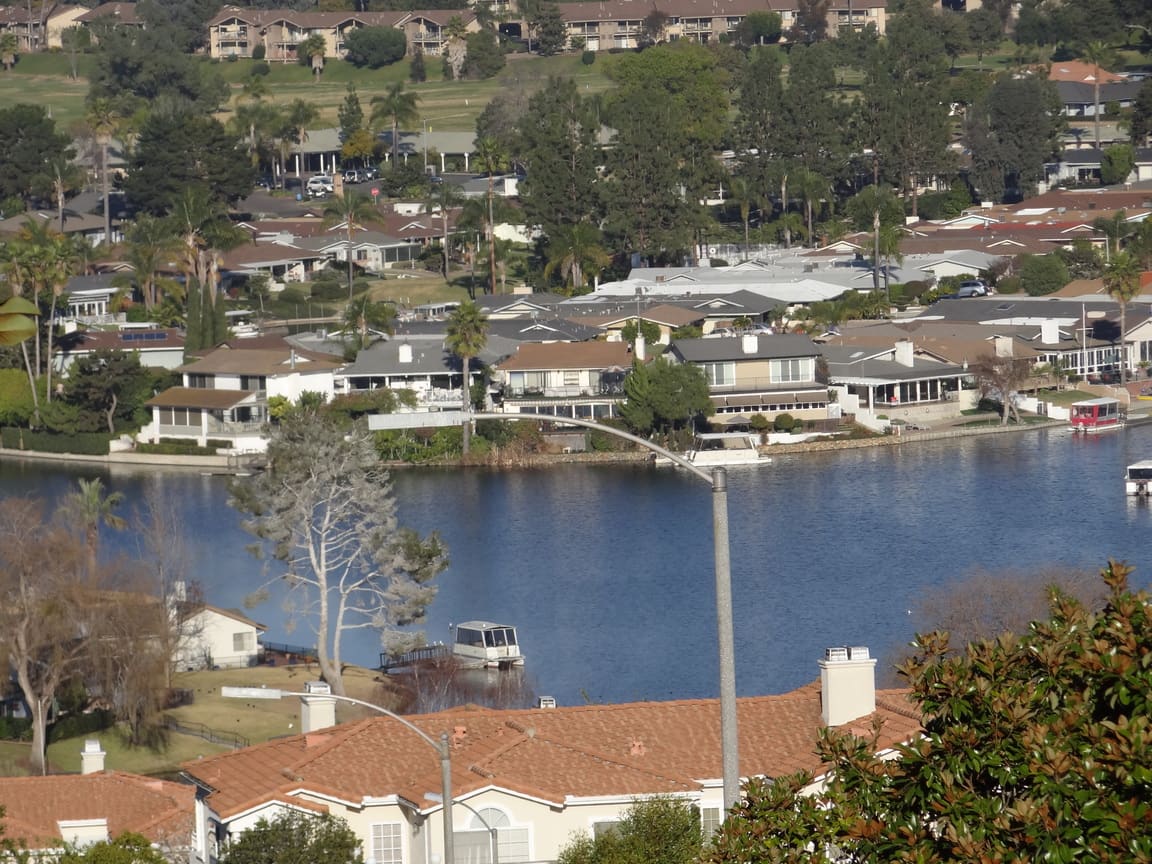
This overview of the San Marcos real estate market is based on MLS data. I can share more details for neighborhoods of interest (e.g., San Elijo Hills, Lake San Marcos, Santa Fe Hills).
Please contact me at (760) 840-1360 directly or by text to discuss your personal housing needs, timing, lifestyle, budget, and questions. Then we can create a strategy to buy your new San Marcos home if that’s your intent now or in the future.
Are you considering selling your San Marcos home? Let’s discuss the current market conditions that will have an impact on your sale and review a market and equity analysis. We can then develop a plan to sell your home for the best price, terms and conditions.
If you would like to know more about your home’s current market value, please reach out to me at (760) 840-1360.